Create Elastic Search cluster + Kibana + Logstash using Azure
in Blog
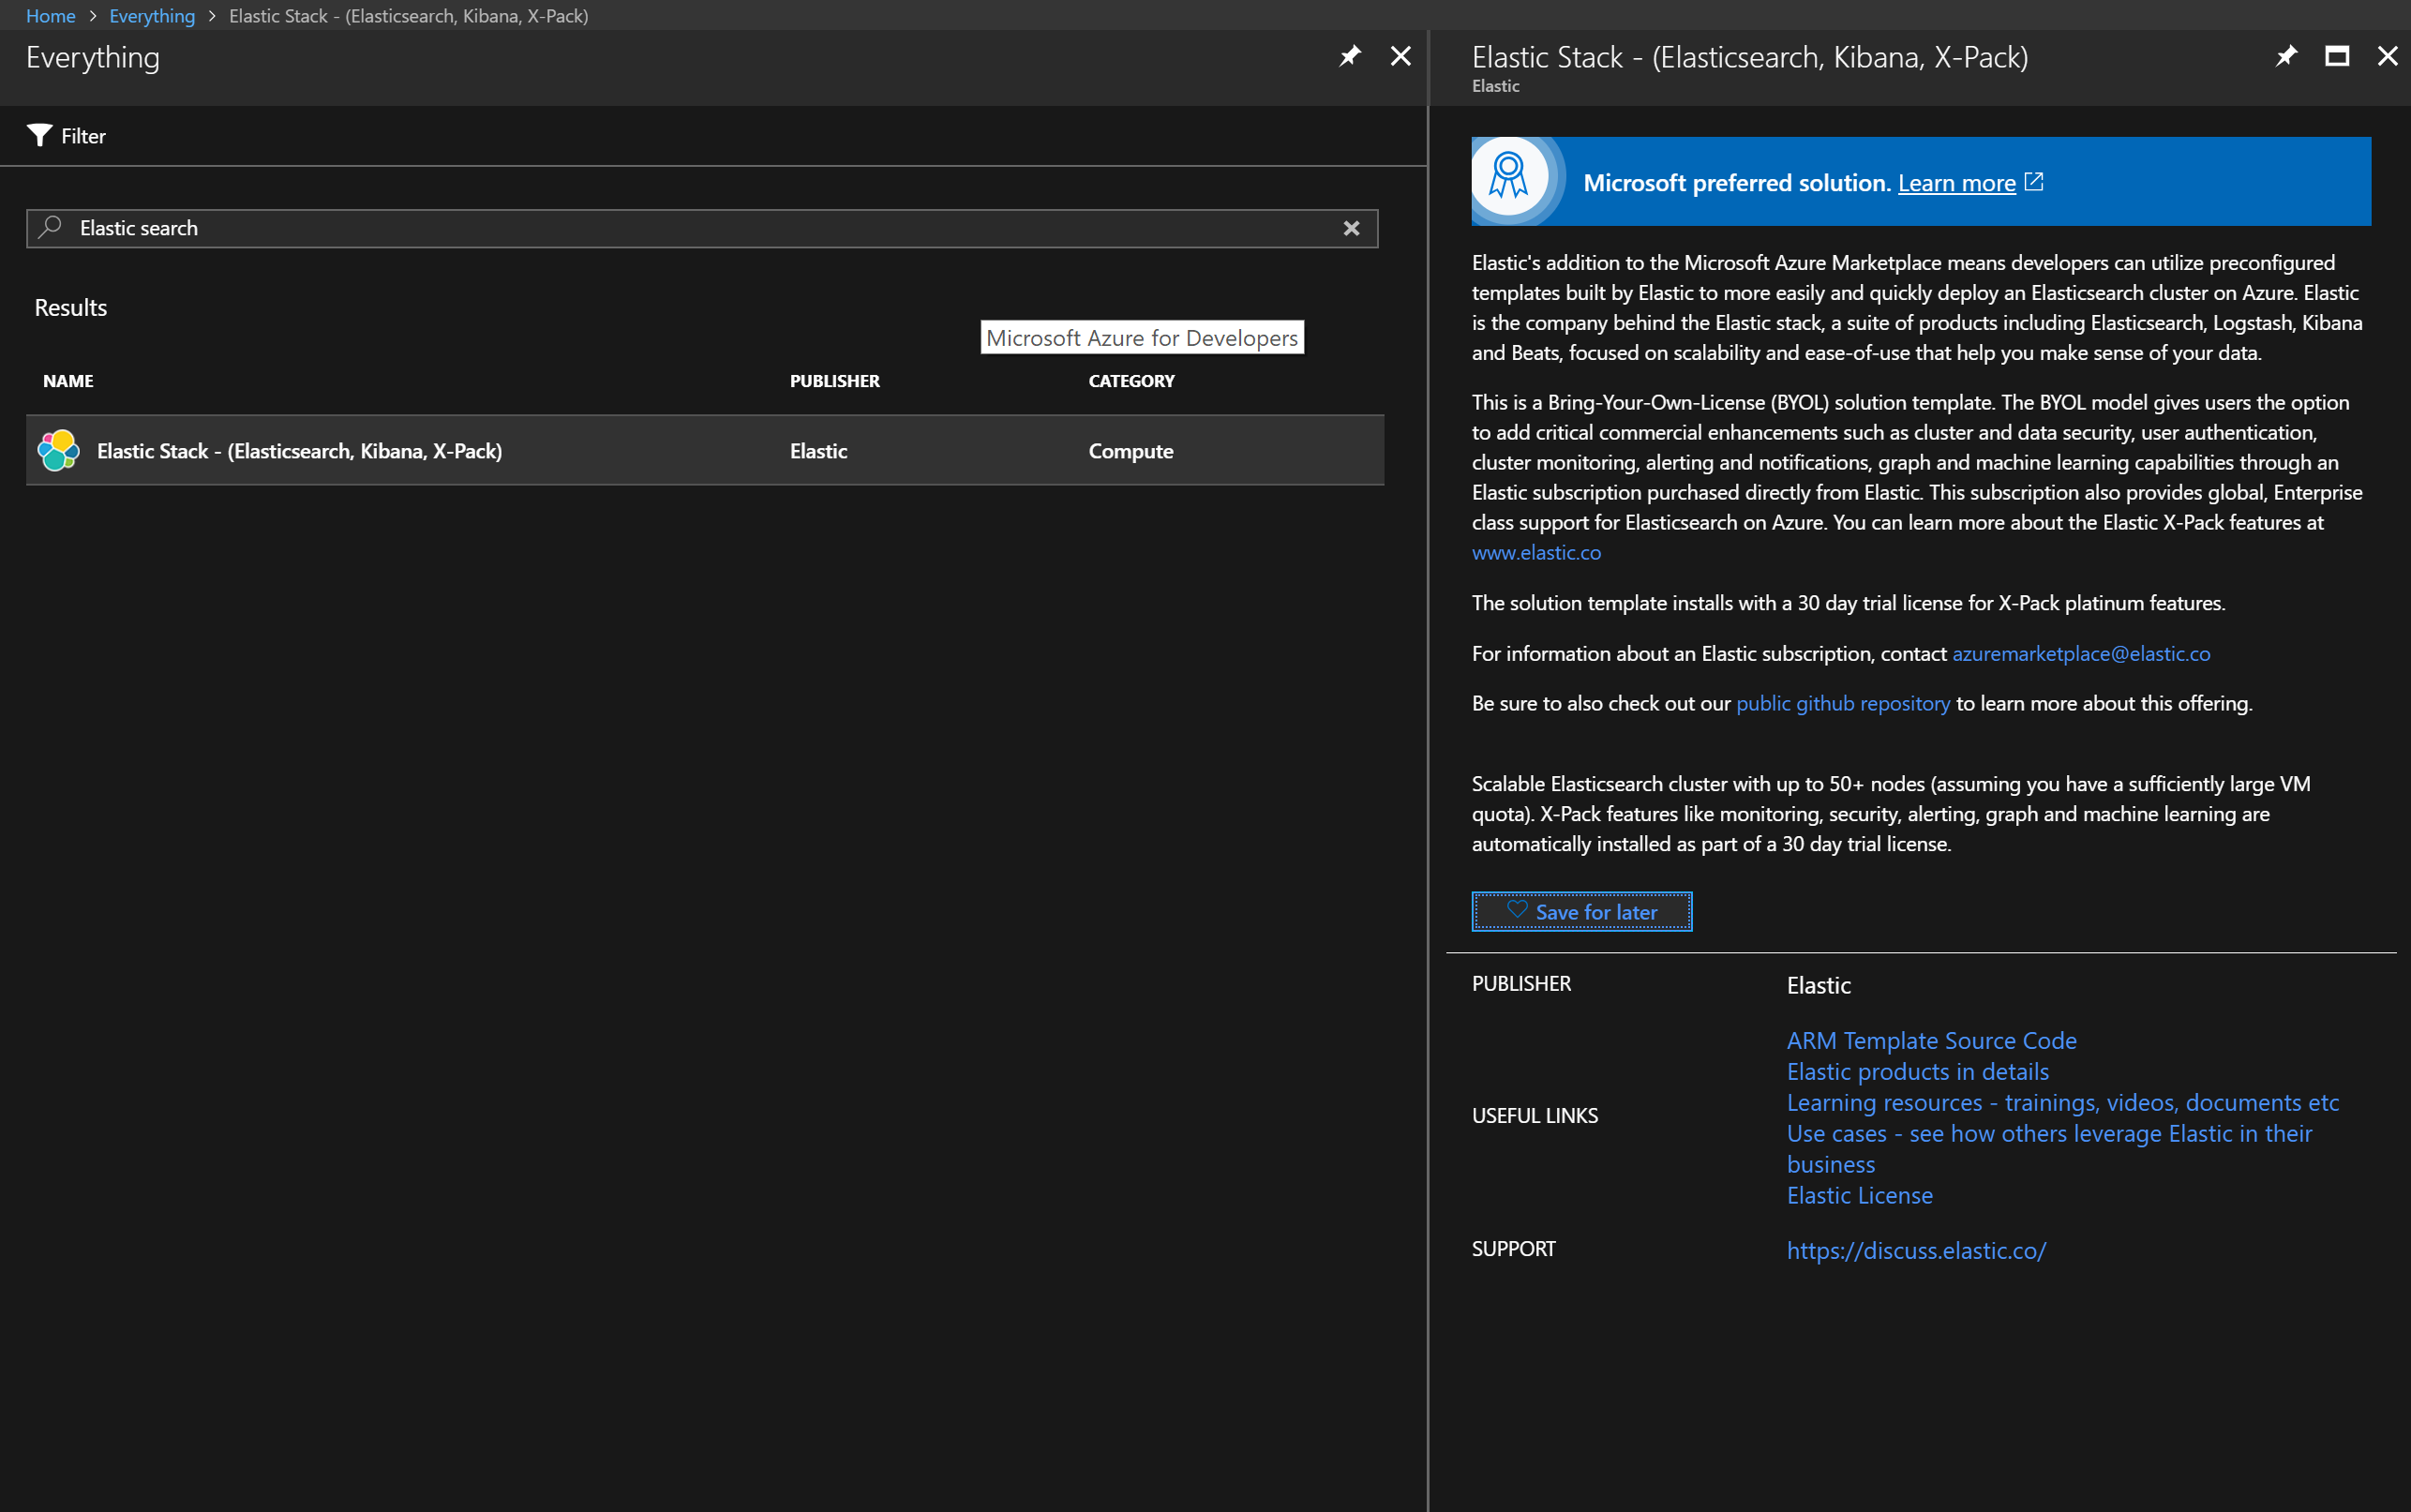
Search for Elastic Search in Azure Marketplace. You will find this template:
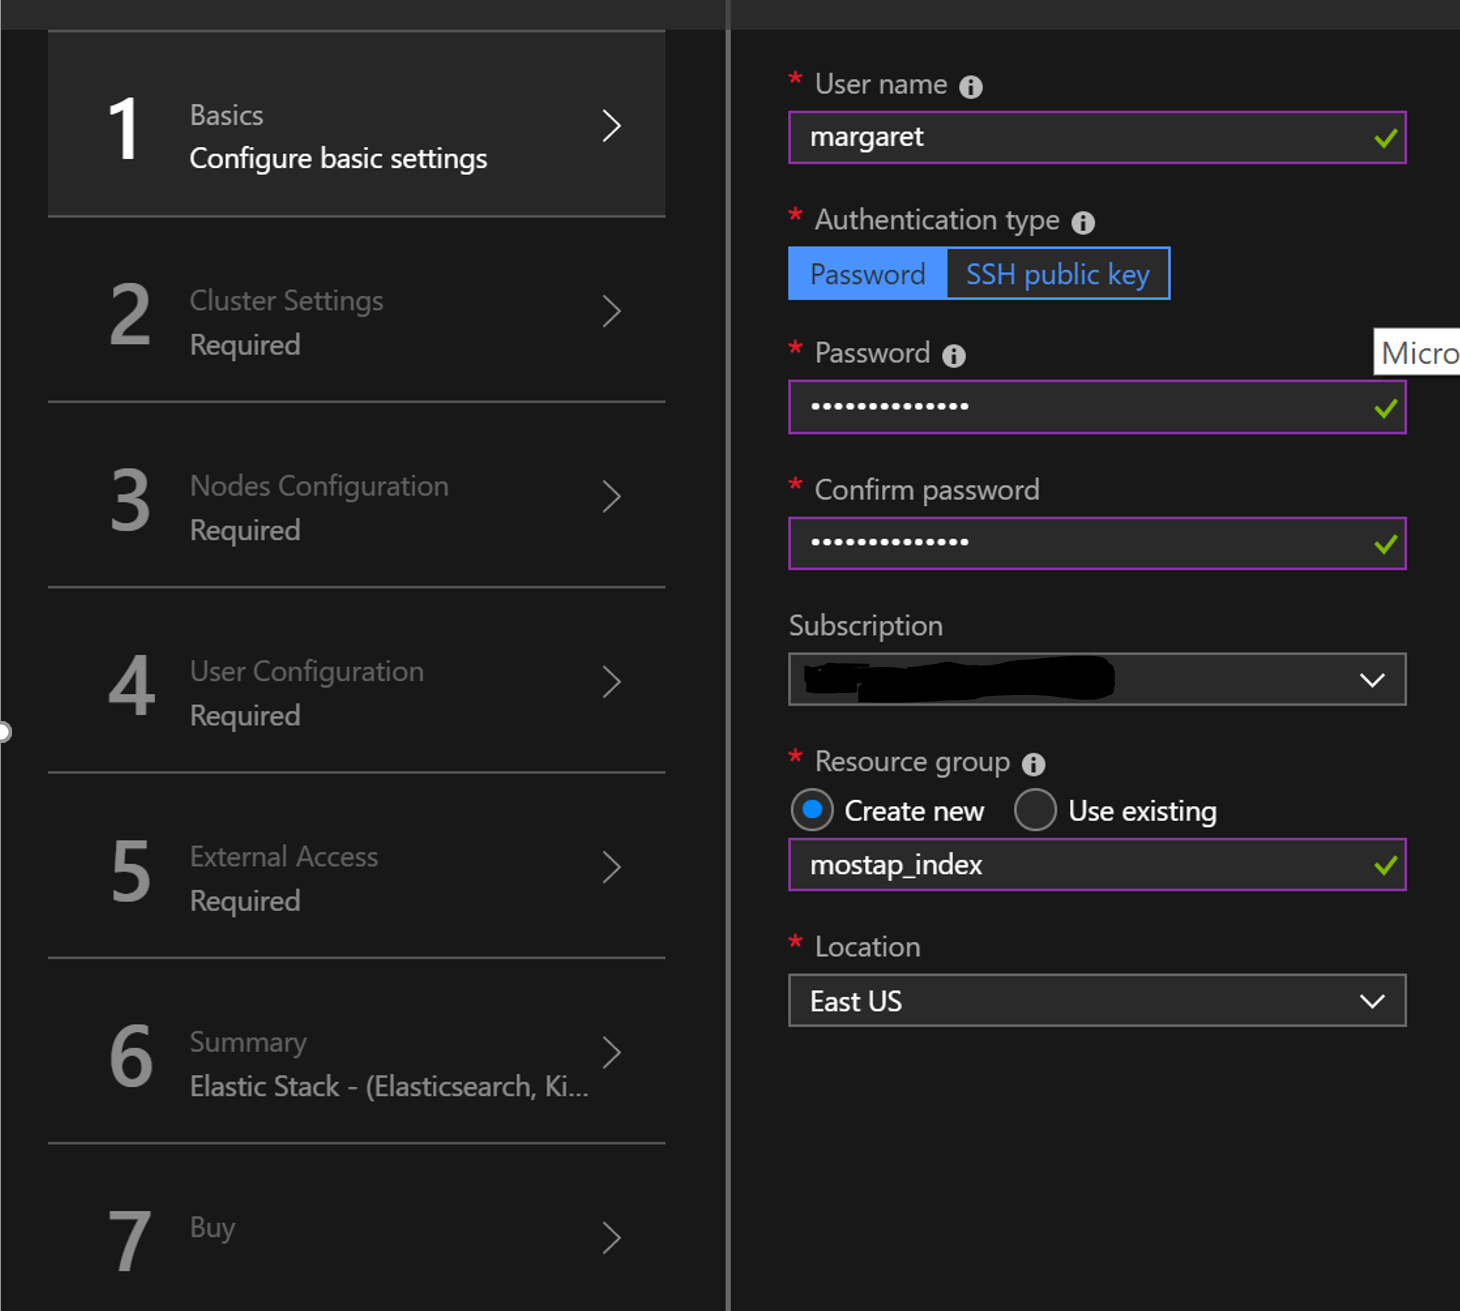
Add user name and credentials.
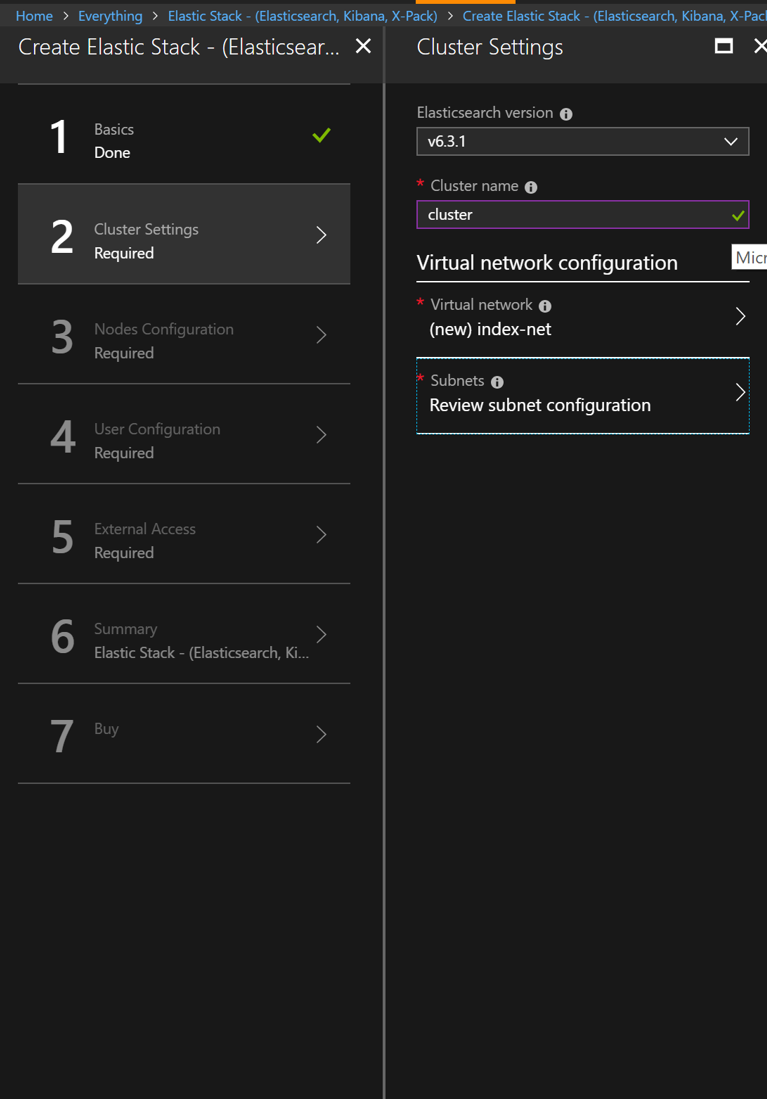
Creare your Vnet and subnet. If you want to add some web api after, you will need to add your web app to the same Vnet.
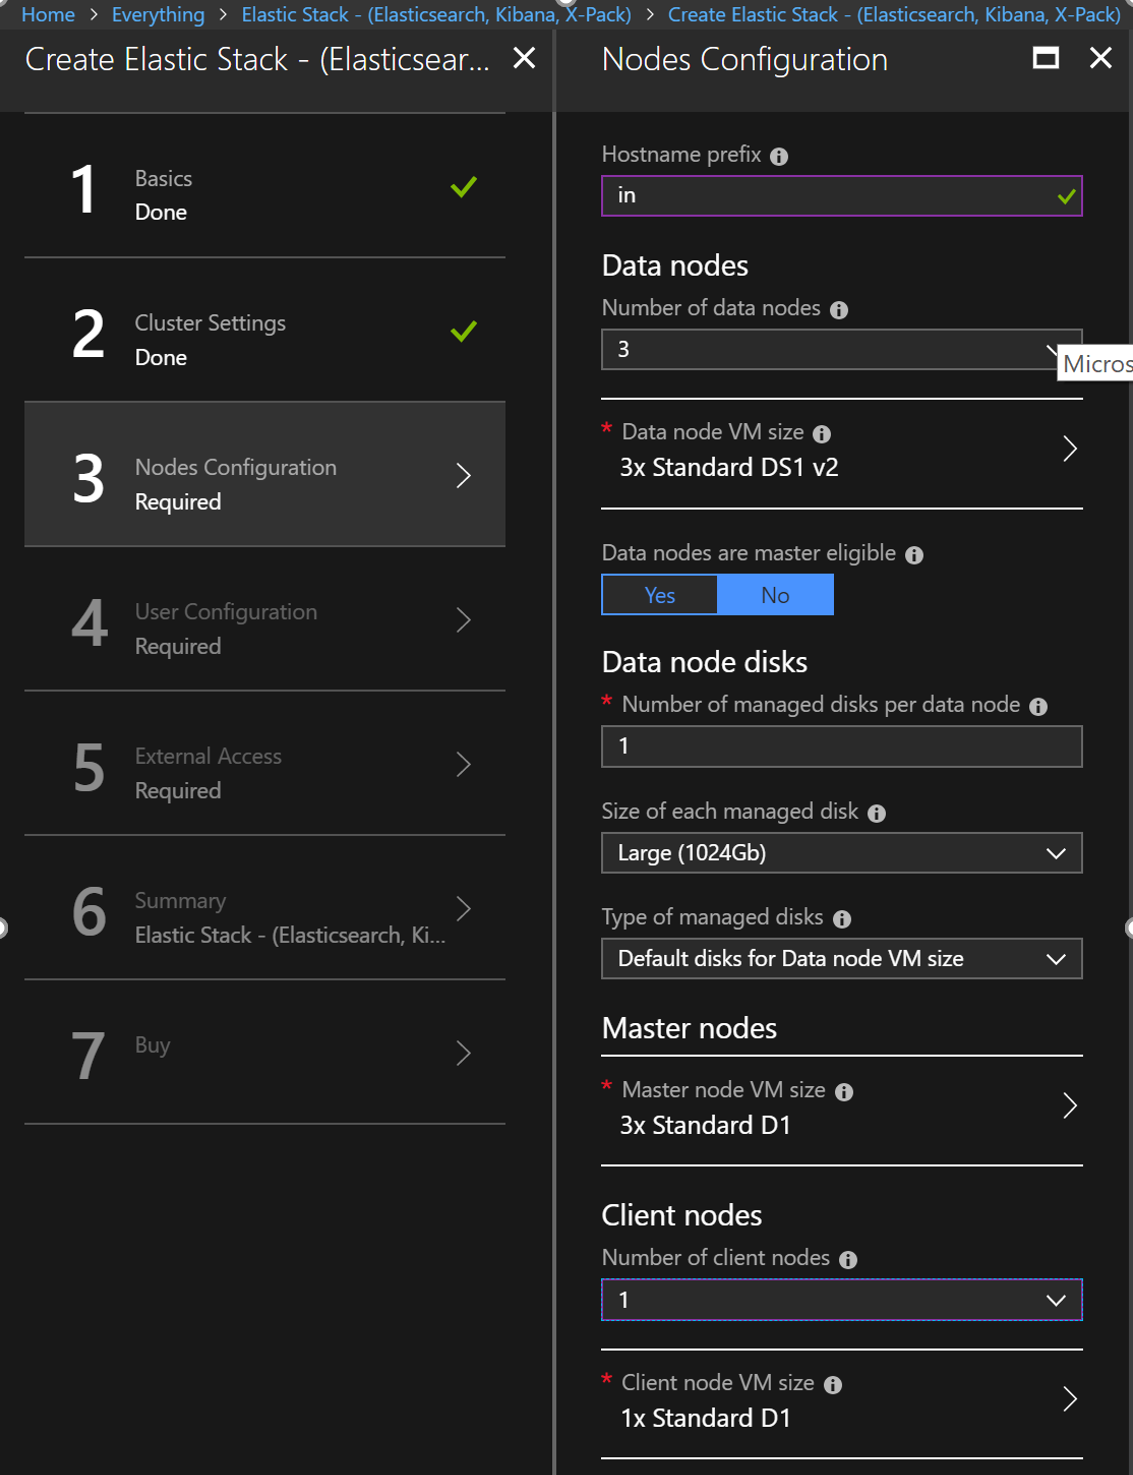
Create 1 client node
By the way here you don’t need to add user name. For example, for Kibana you will use “elastic” as a user name to login as a superuser. You need to enter only your passwords.

- You want to install Kibana for visualization. You will receive an error if you enable jump box. .
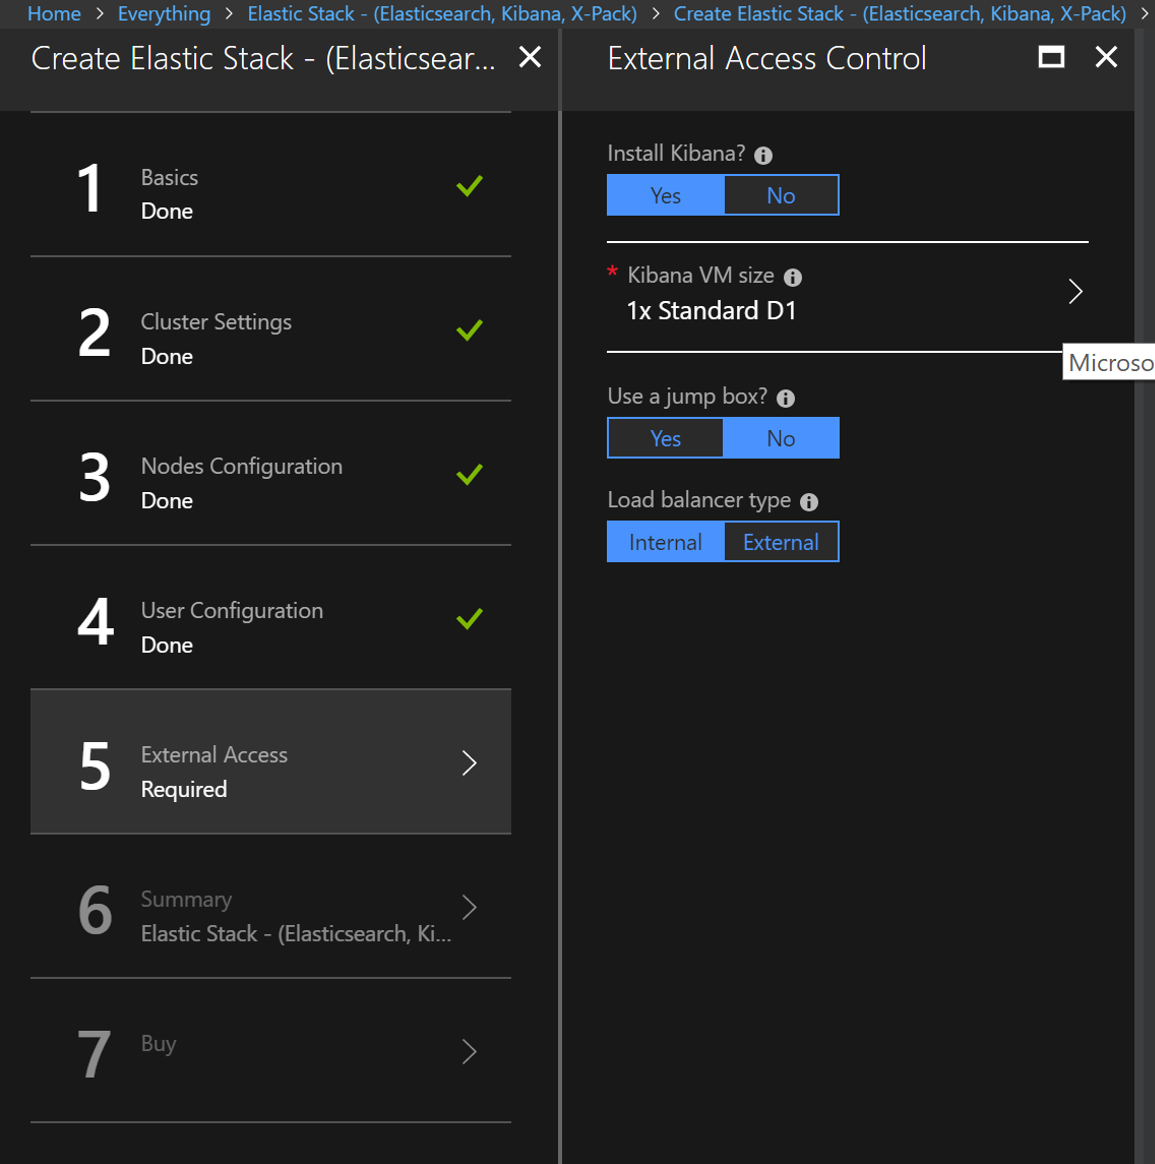
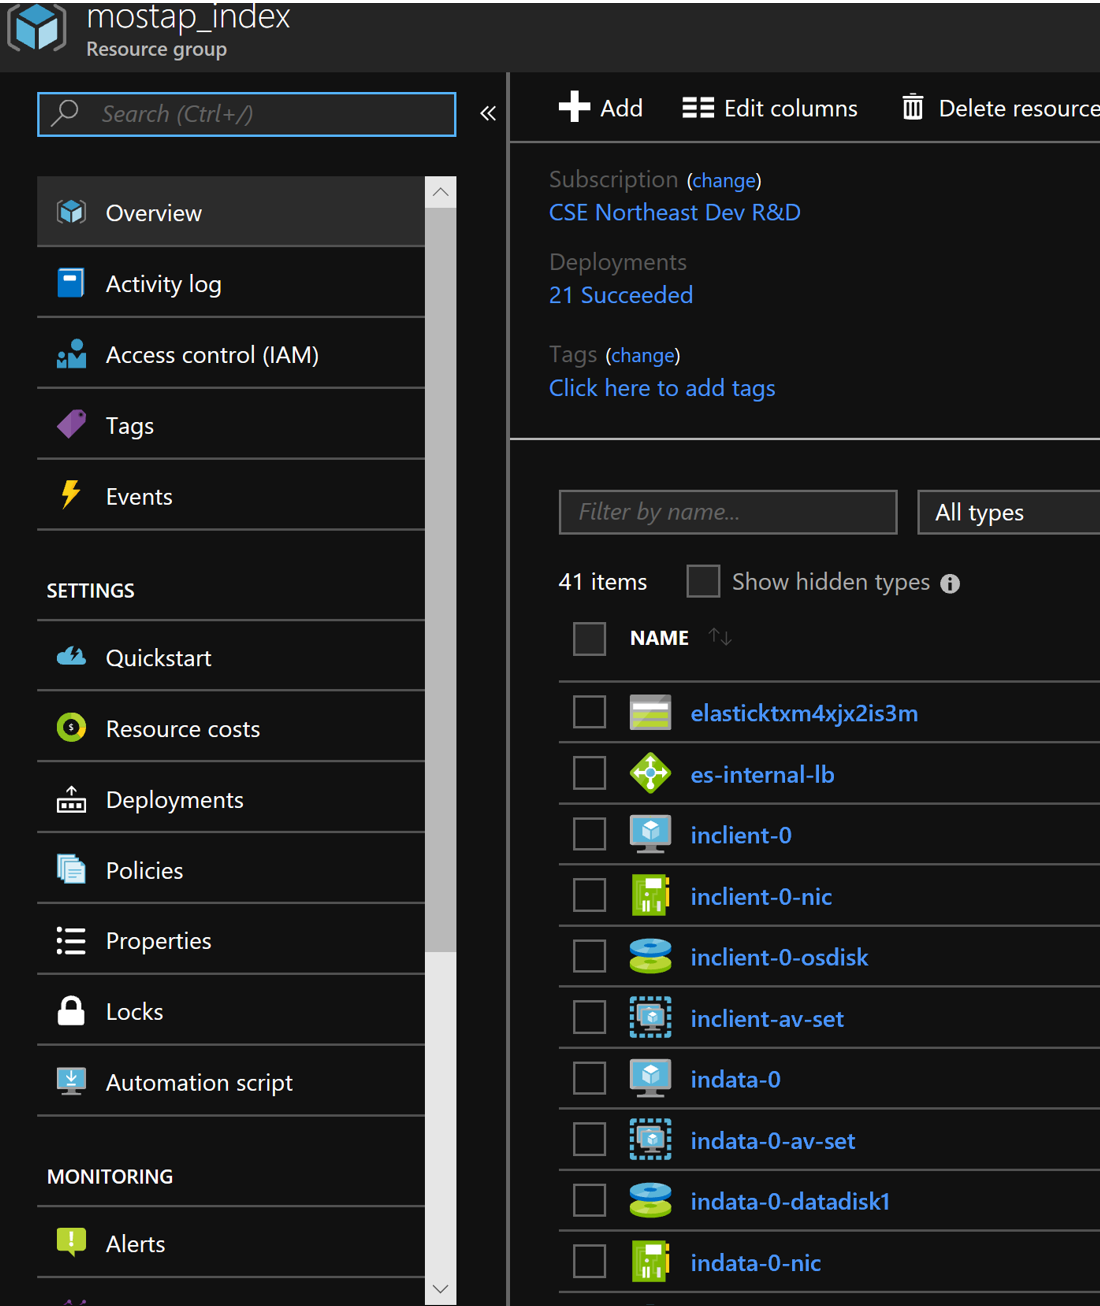
- Click ‘ok’ for everything else after that step and wait when your resources will be deployed. When Elastic Search successfully deployed on Azure you will see something like this.
 To see deployment status click on the bell – upper right corner.
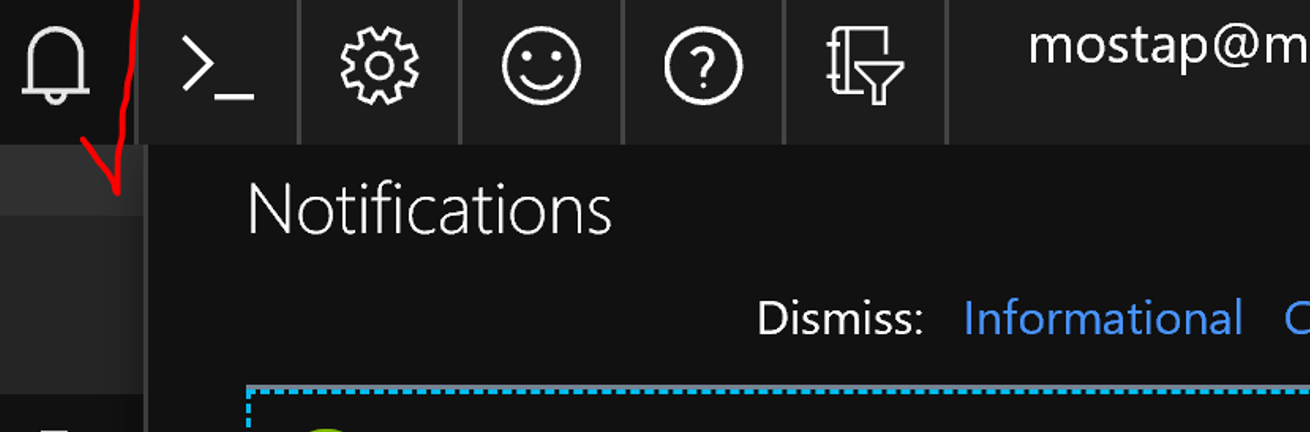
Search in your Resource Group for Kibana virtual machine. Go to an VM overview. Copy DNS or public IP address if you prefer, after - check networking tab.
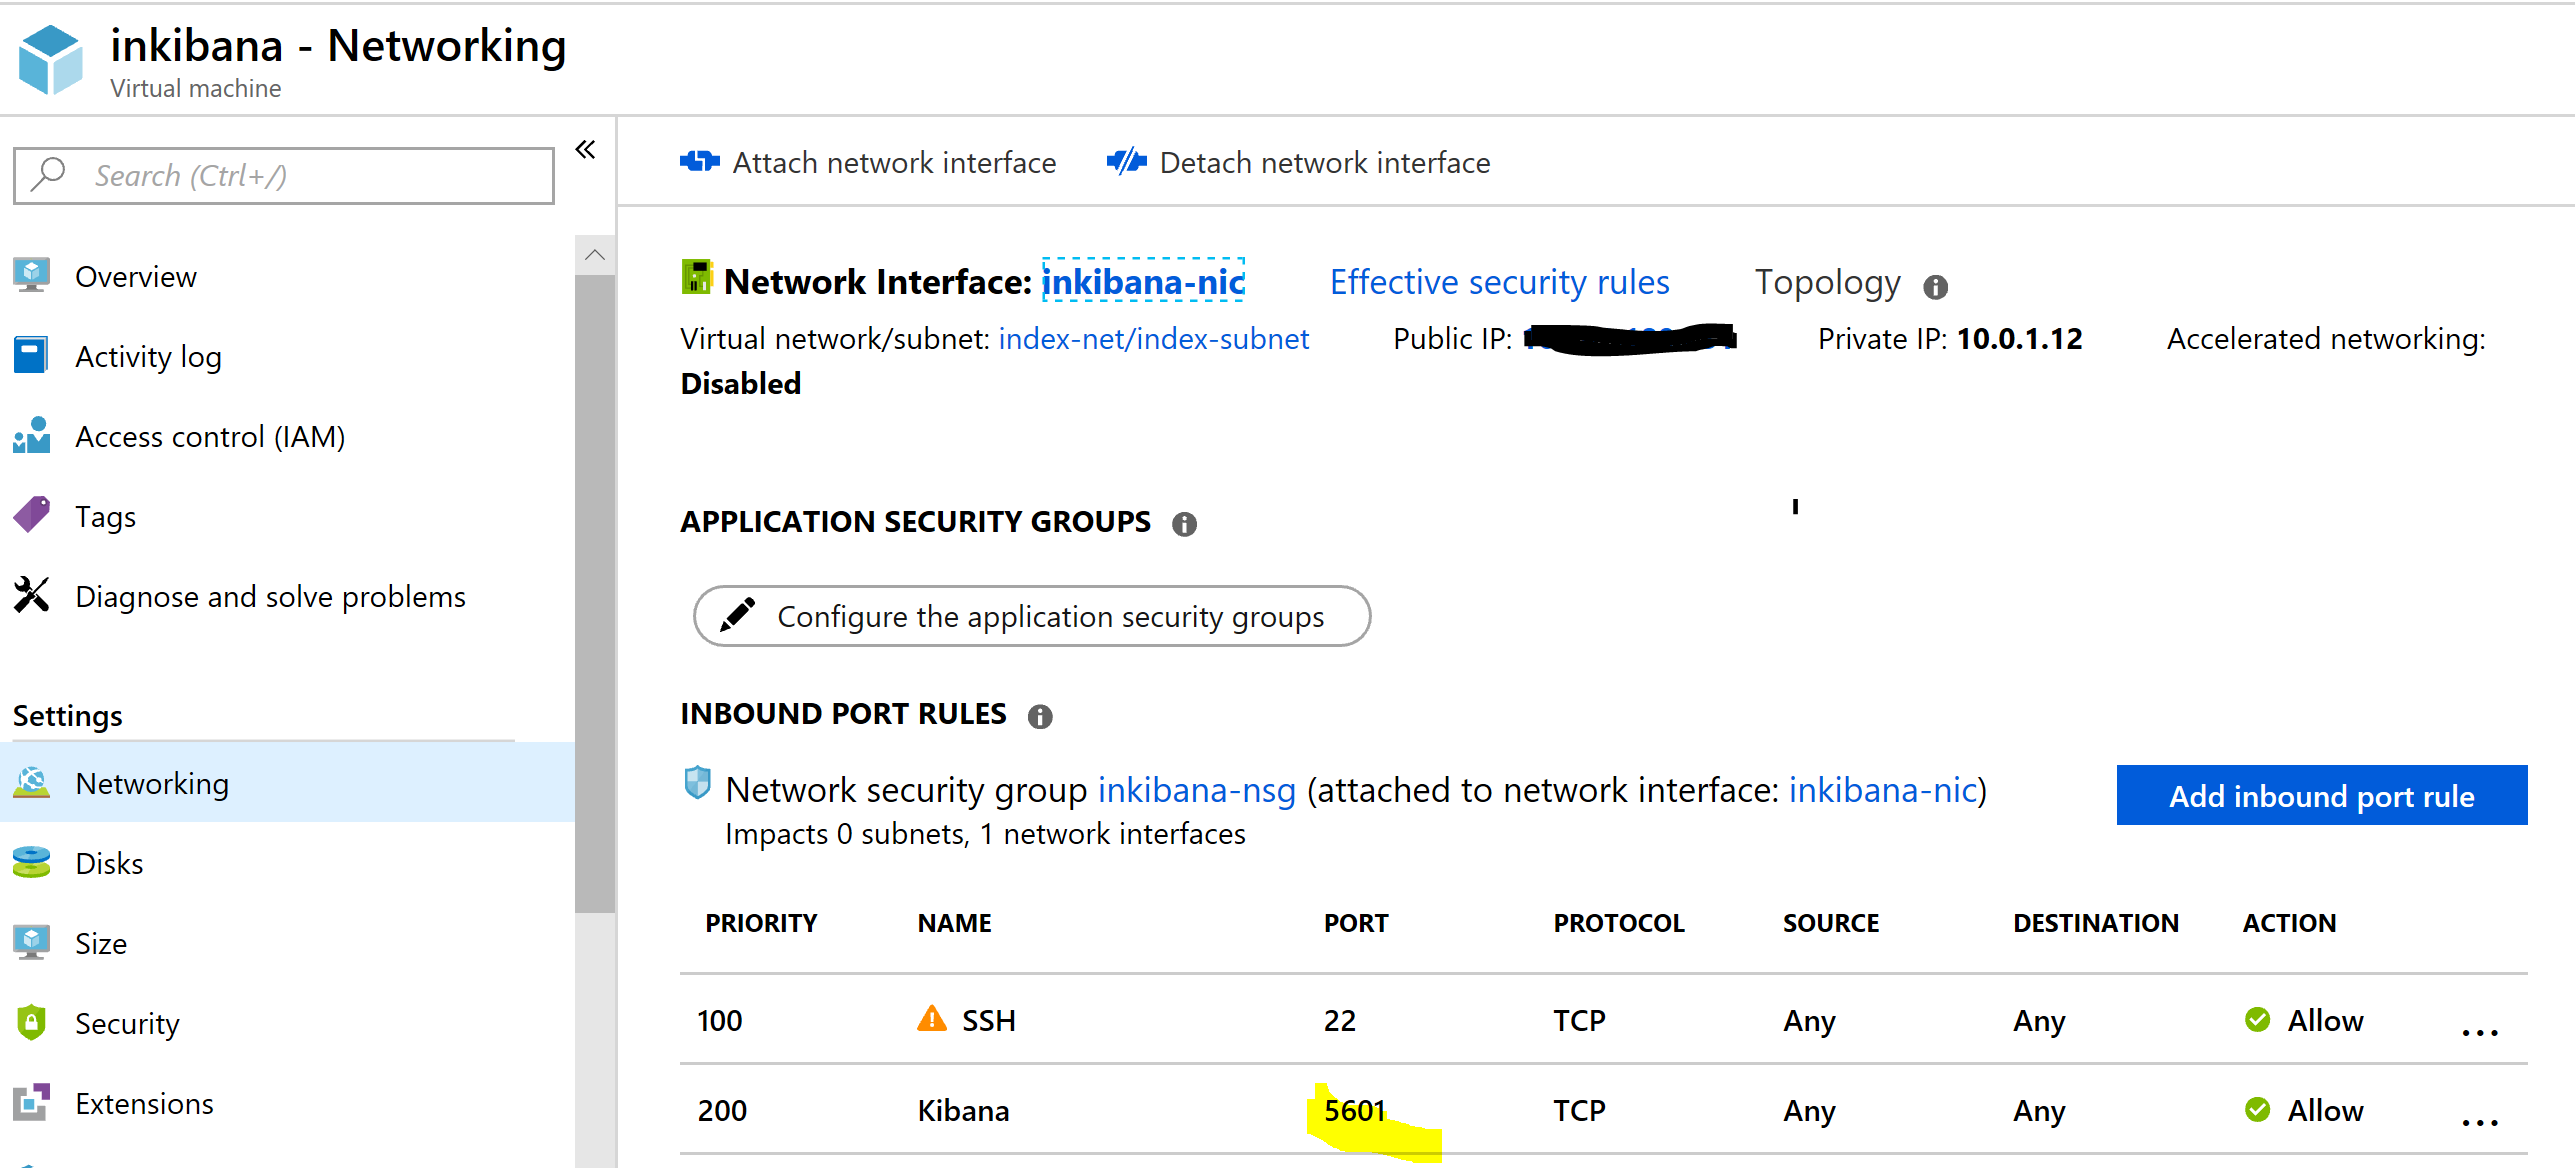 You can see here what ports are open. Add Kibana dns/ip + port - 5601 in the browser and sign in to Kibana.
 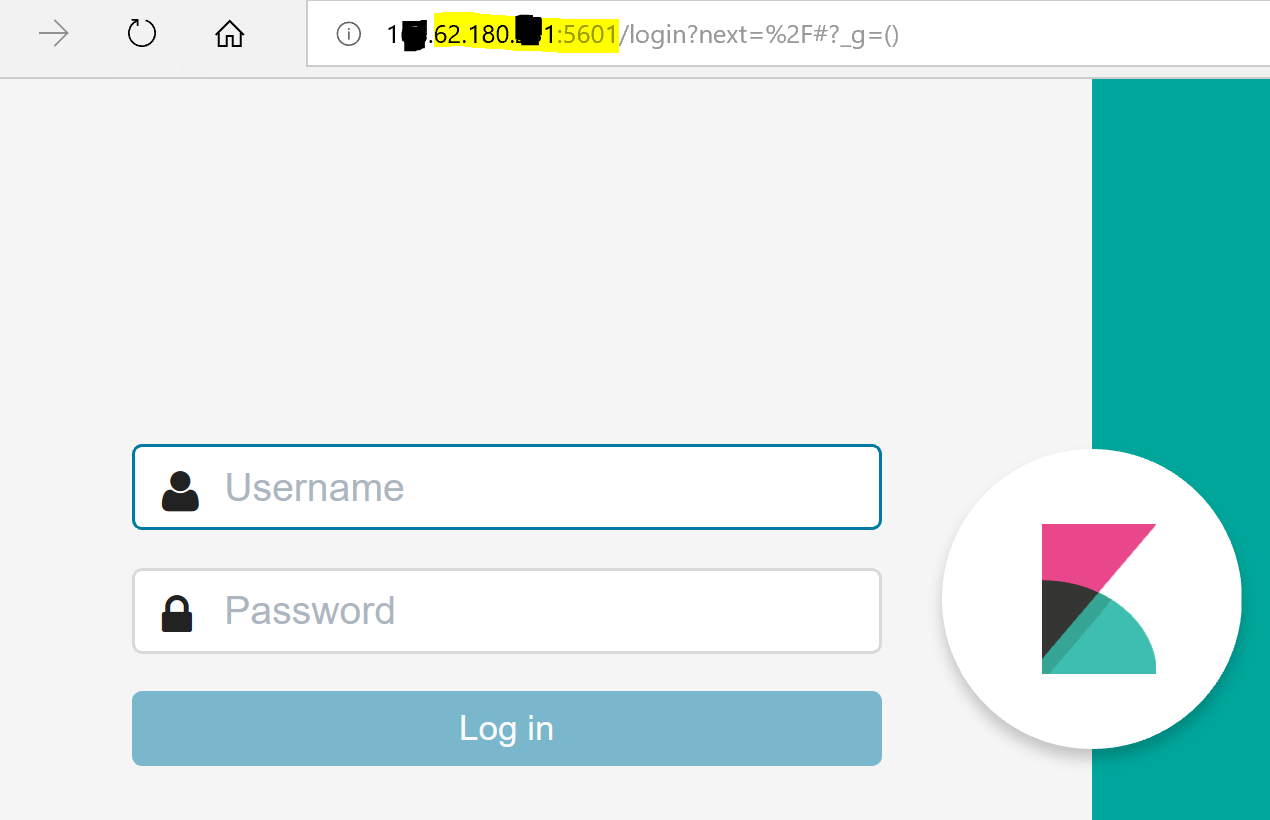 During provisioning elastic search cluster you added 2 passwords. To login and to see Kibana dashboard you can use you can use username ‘Elastic’ and your password to login as a superuser, or username ‘kibana’ and your Kibana password. You Kibana dashboard must look similar to this:
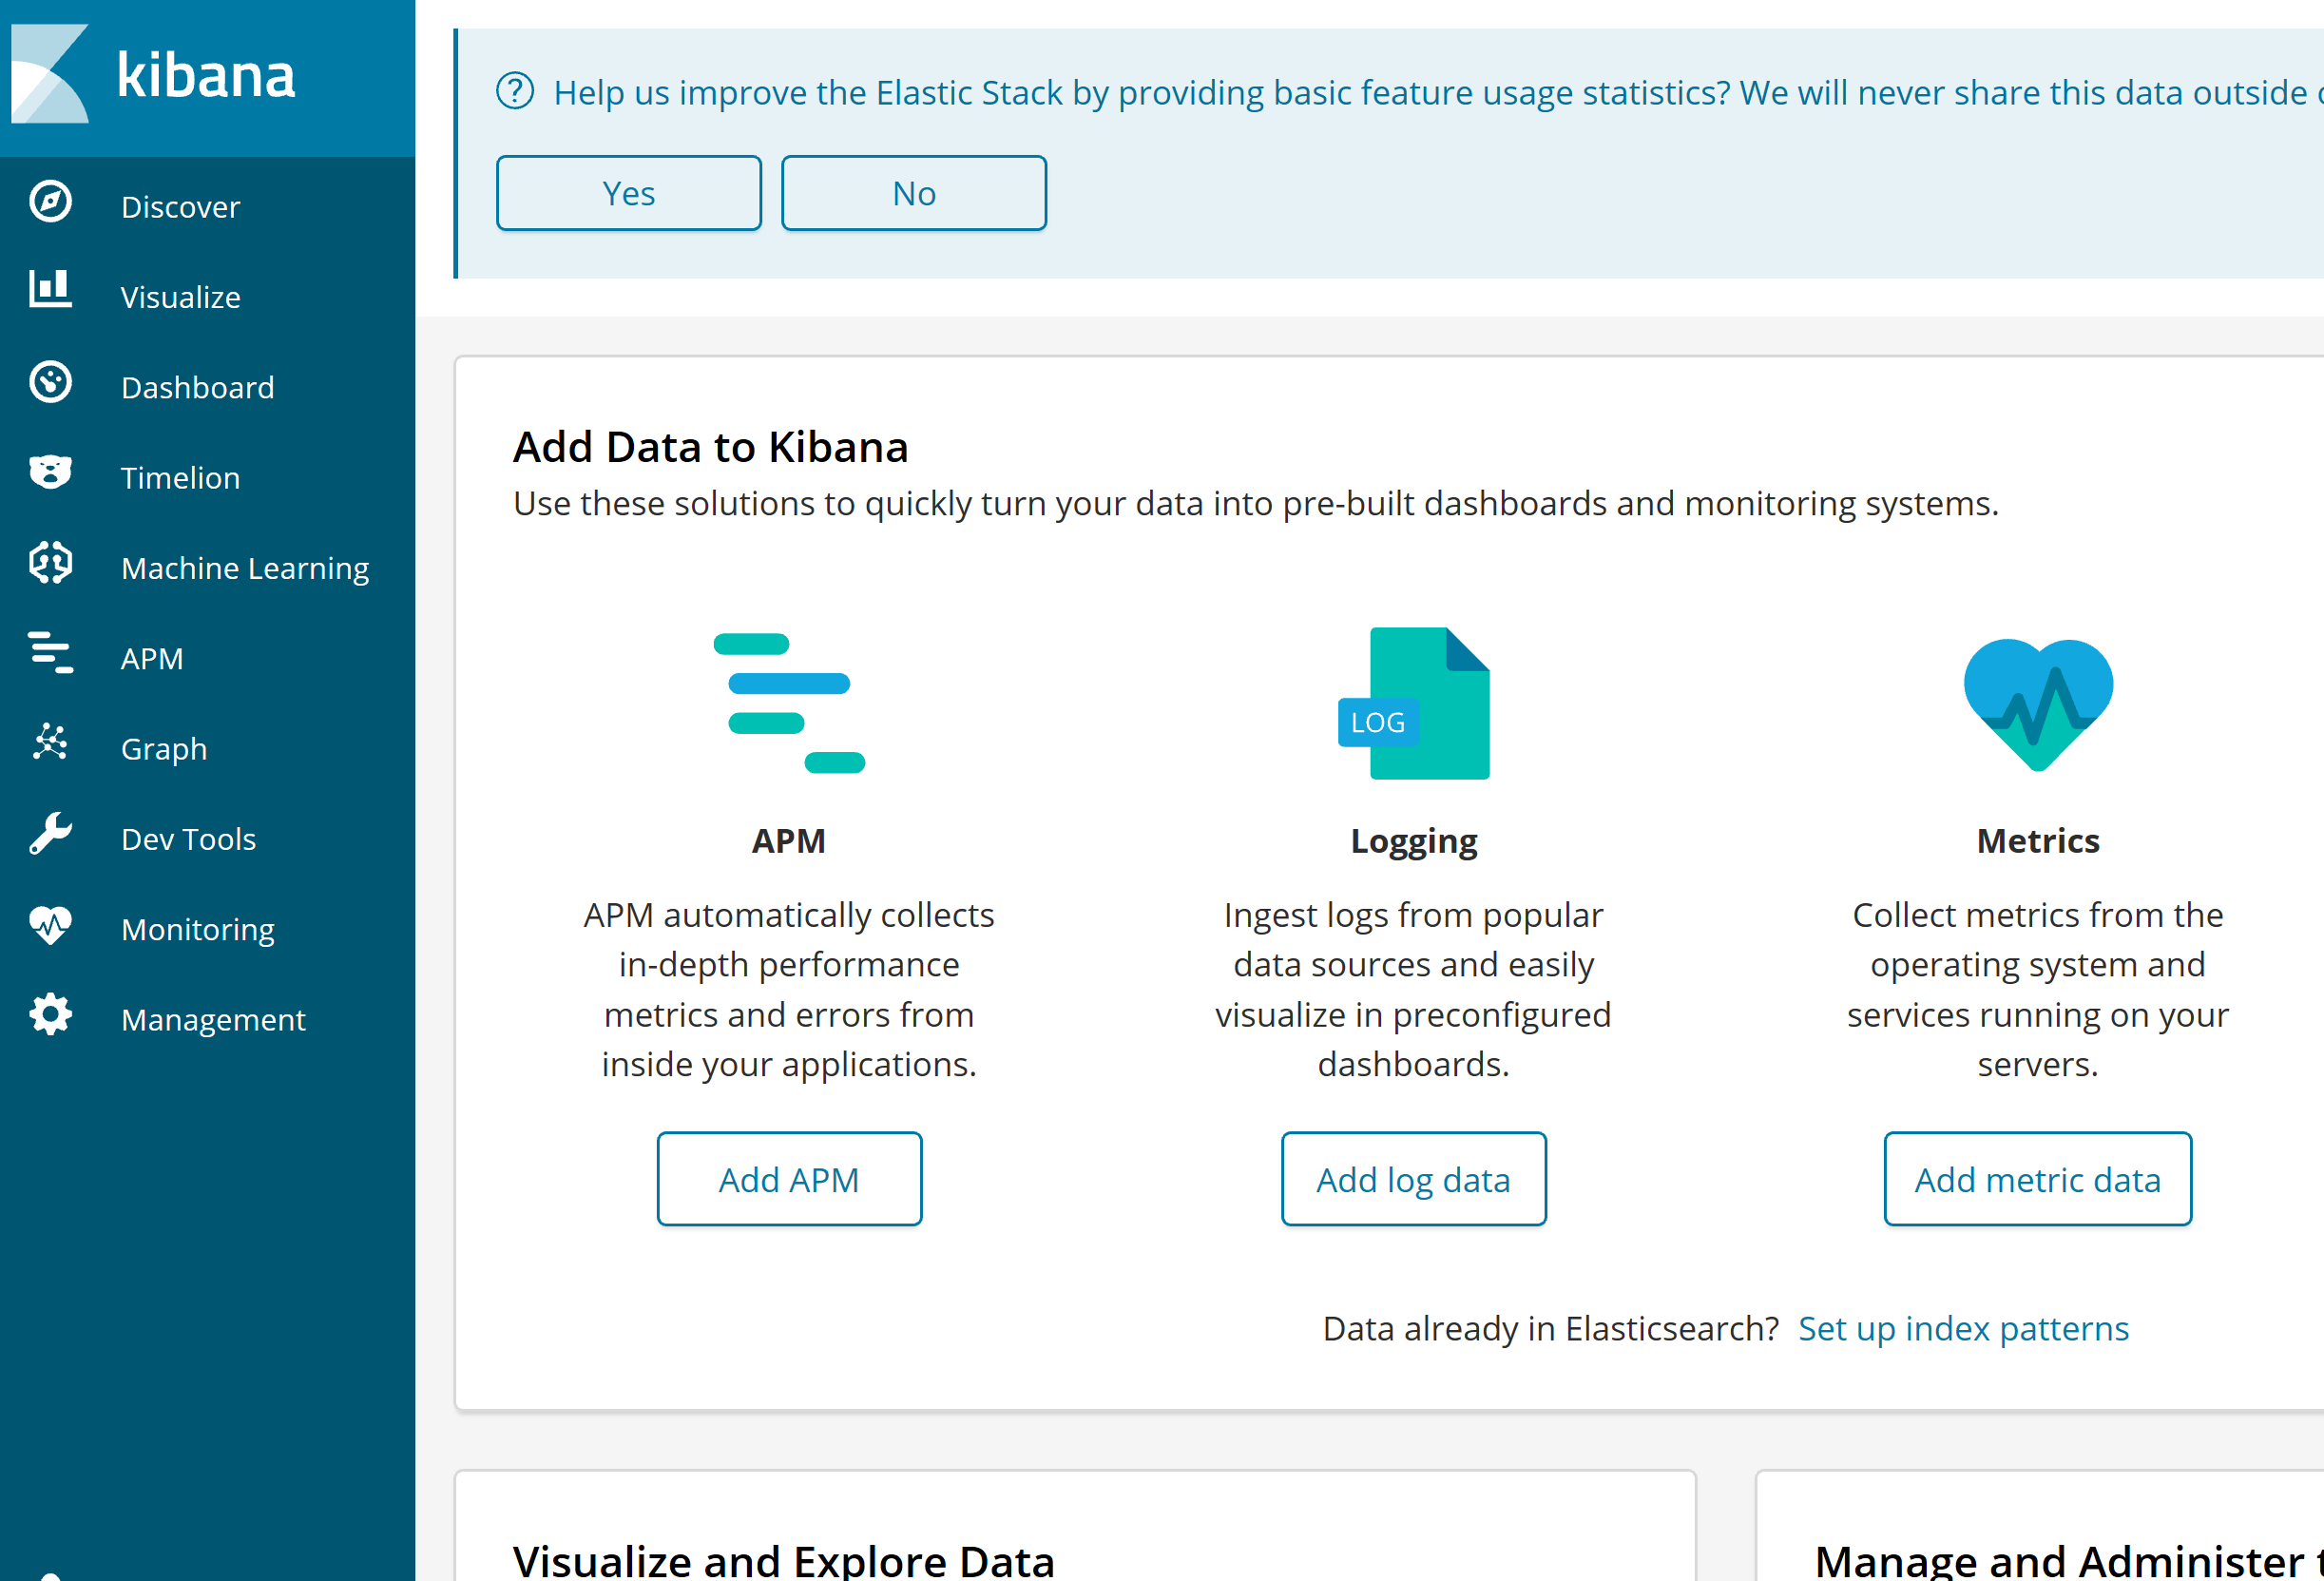
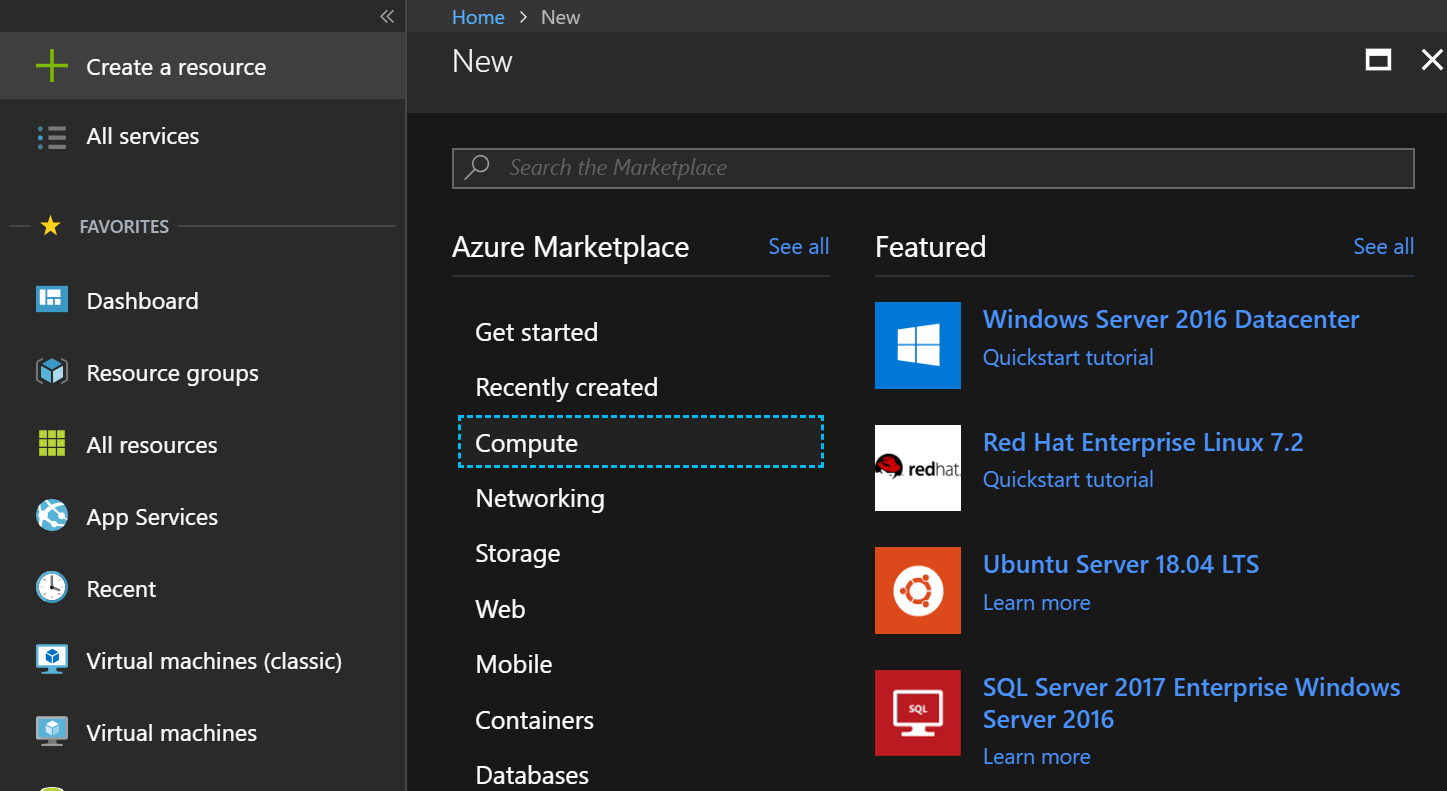
- By default in Azure Elastic Search Marketplace offer/ ARM template you can’t find Logstash. Why do we need Logstash? By using LogStash we can create data pipelines. Lets create Ubuntu VM for Logstash. Go to Azure portal. Click on +. Choose ‘Compute’ -> Ubuntu Server.
- Add name and password for your VM. Choose the same Resource Group and region. Later we would add this VM to the same Vnet.
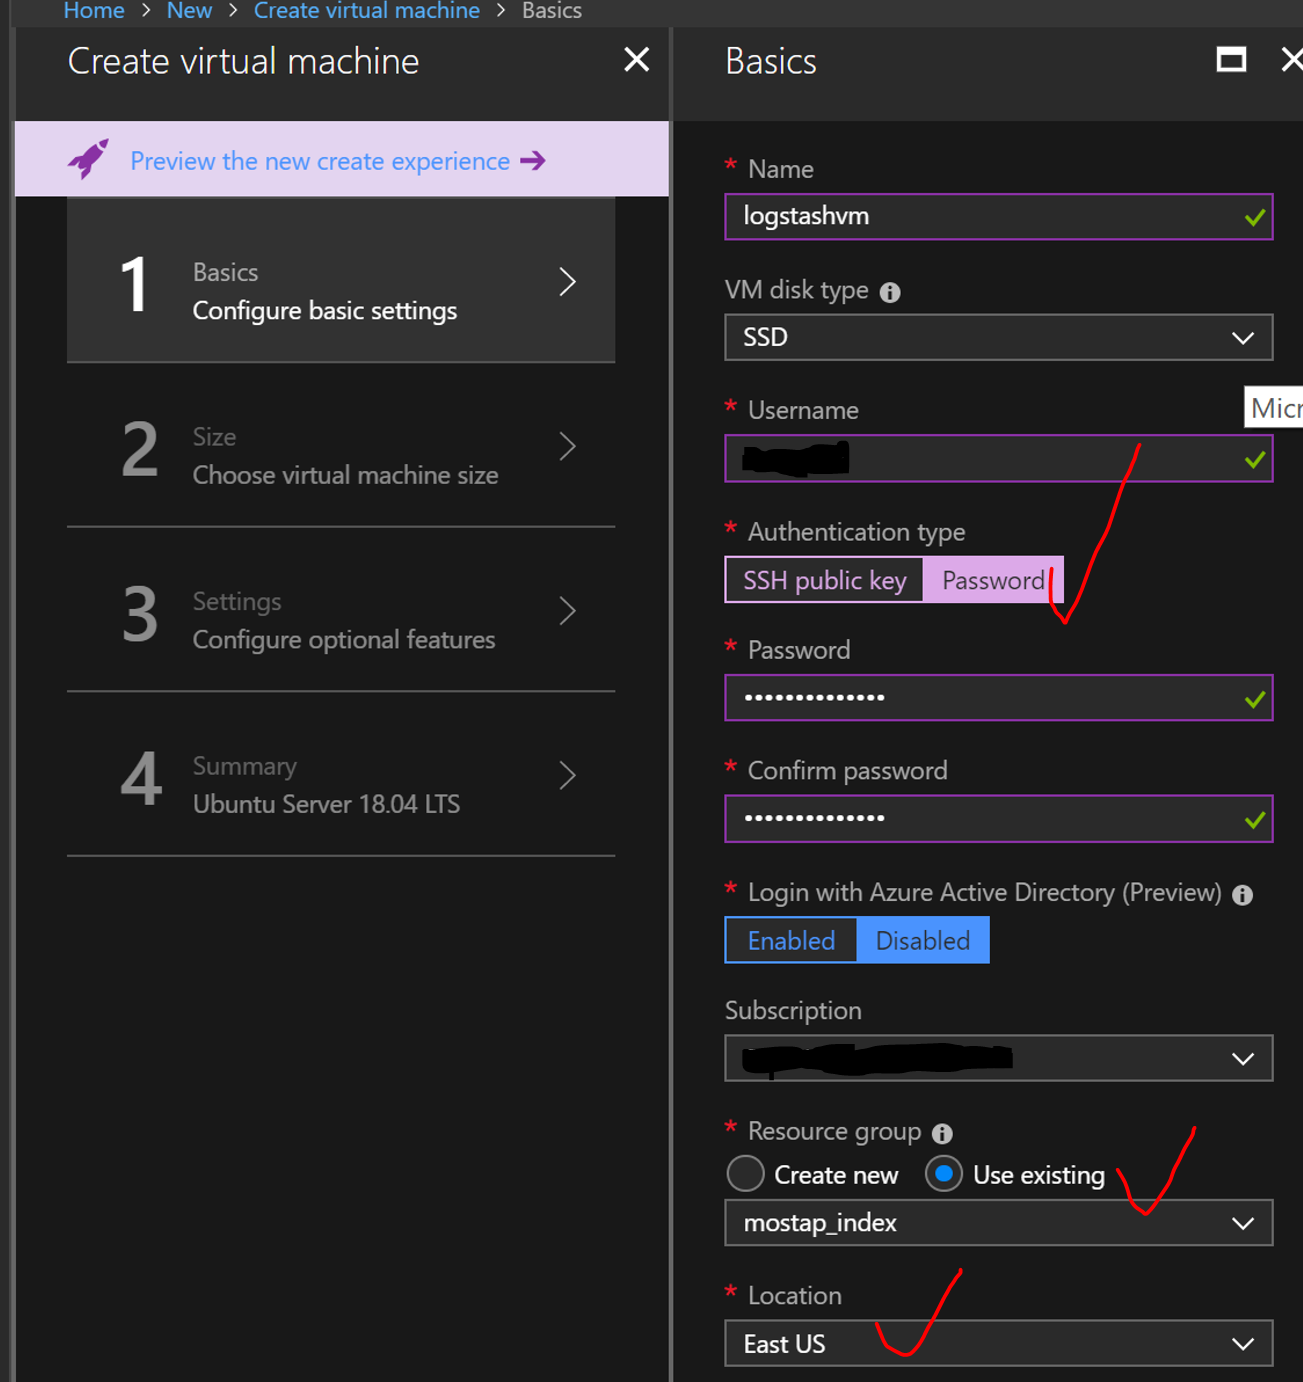
- Make sure that your VM is in the same Virtual Network and we have public ip address (better if it is static). Also choose http, https, ssh as public inbounds ports. You can delete them later. Click ok and click create button after. And wait for deployment.

- Install bash for Windows to ssh to you Logstash VM https://www.windowscentral.com/how-install-bash-shell-command-line-windows-10 Find your new Ubuntu VM that you’ve just created.
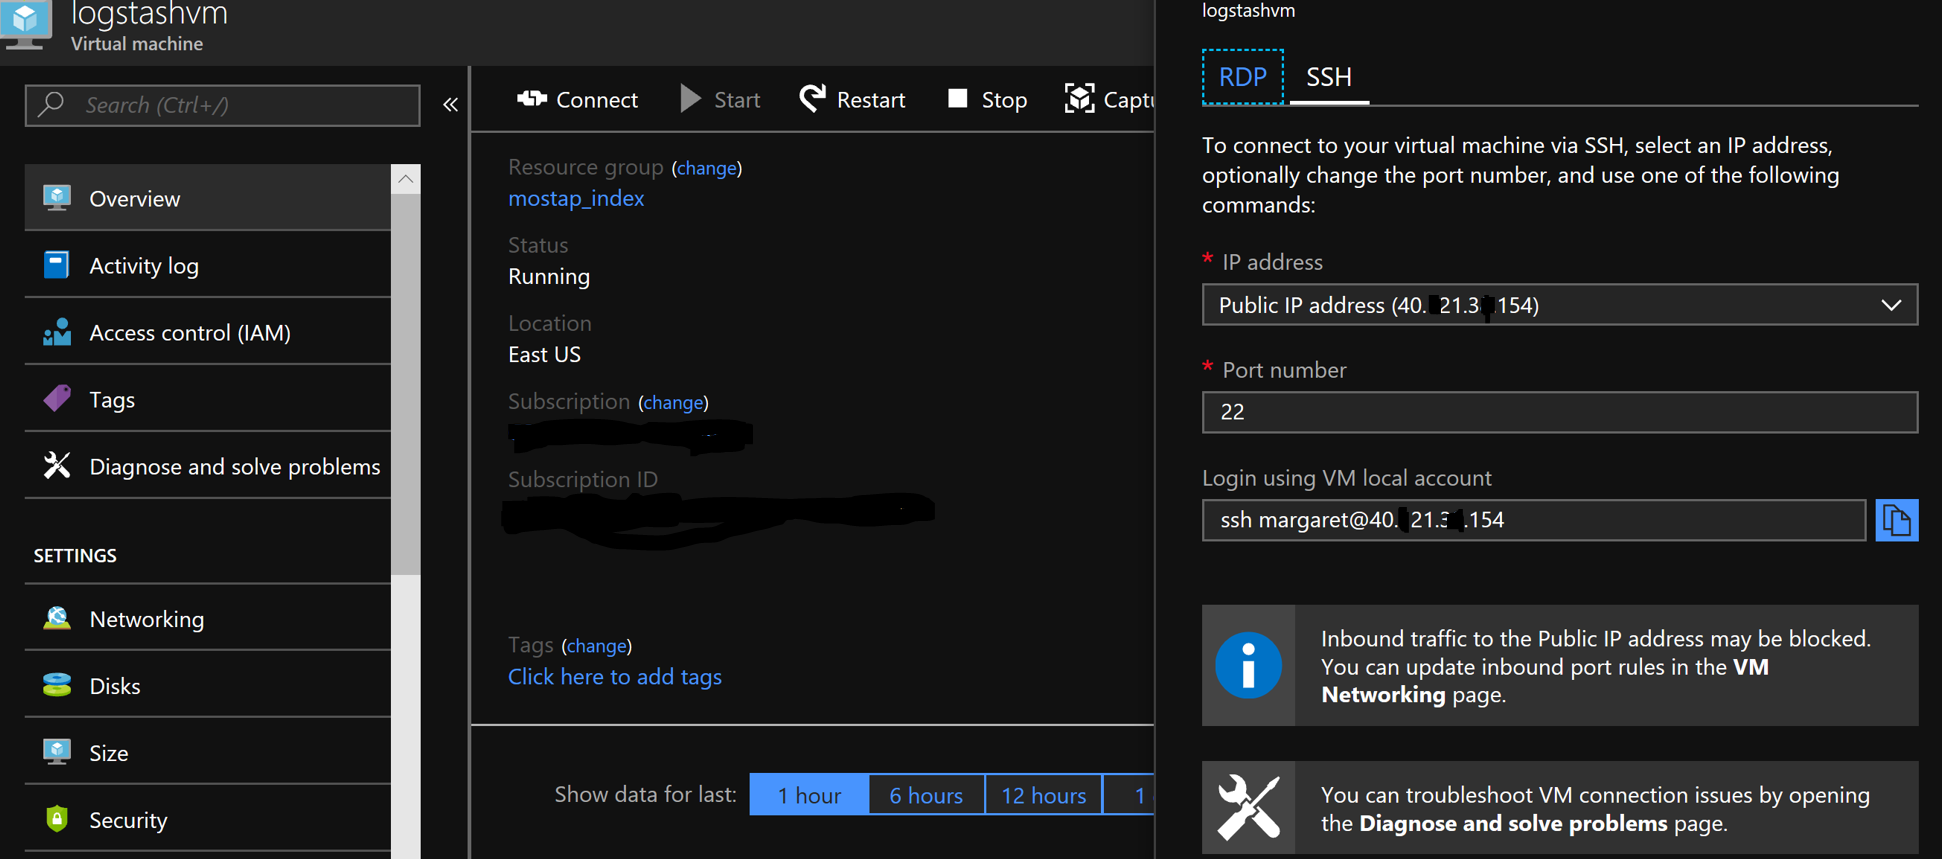 Click on connect and ssh and copy command to you bash window, after enter your password.
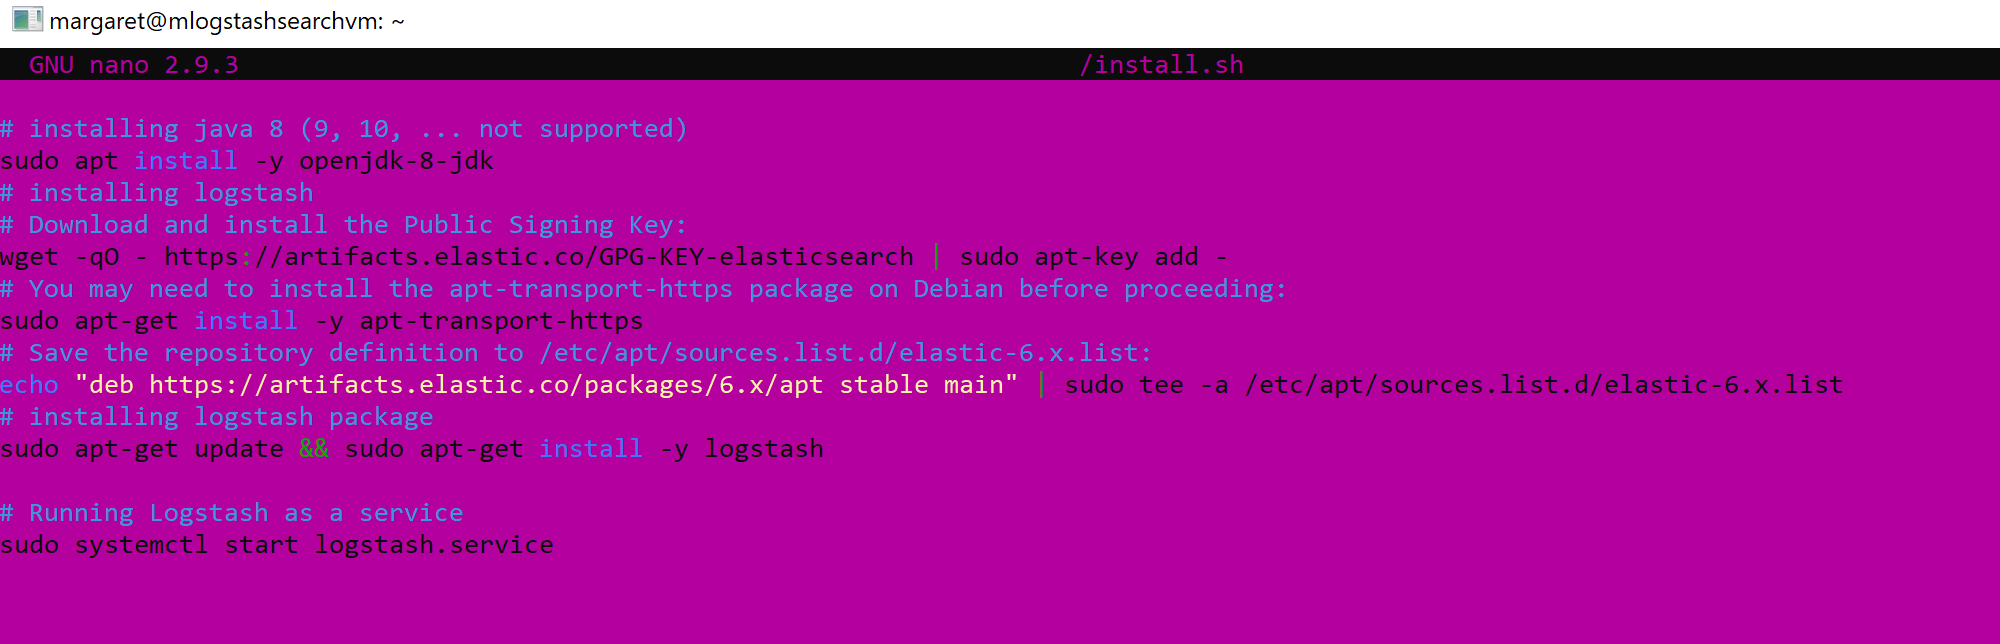
- Run script below to create a new instalation file.
sudo nano ./install.sh
Paste those lines to your file
# installing java 8 (9, 10, ... not supported)
sudo apt install -y openjdk-8-jdk
# installing logstash
# Download and install the Public Signing Key:
wget -qO - https://artifacts.elastic.co/GPG-KEY-elasticsearch | sudo apt-key add -
# You may need to install the apt-transport-https package on Debian before proceeding:
sudo apt-get install -y apt-transport-https
# Save the repository definition to /etc/apt/sources.list.d/elastic-6.x.list:
echo "deb https://artifacts.elastic.co/packages/6.x/apt stable main" | sudo tee -a /etc/apt/sources.list.d/elastic-6.x.list
# installing logstash package
sudo apt-get update && sudo apt-get install -y logstash

# Running Logstash as a service
sudo systemctl start logstash.service
Press ‘CTRL+X’ to exit and ‘Y’ It will save your changes automagically. Let’s run that file
sh ./install.sh
It will take a while to install all packages. More details you can find here: https://www.elastic.co/guide/en/logstash/current/installing-logstash.html
https://linuxconfig.org/how-to-install-java-on-ubuntu-18-04-bionic-beaver-linux
- Let’s create a simple data pipeline. Check what is your current directory
pwdYou should be here
/home/usernameLet’s change it
cd /usr/share/logstashsudo bin/logstash -e ‘input {stdin {} } output {stdout { } }’ (if you forget to write sudo you may receive an error that logshash data must be a writable directory) Using this command you can write something in console and receive the same message to console. Maybe you will need to restart your logstash.servise like
sudo systemctl stop logstash.service
sudo systemctl start logstash.service
You should see te message that ‘Pipeline started successfully’ After several seconds you will receive an output into the console with a timestamp.
Thanks
When something is important enough, you do it even if the odds are not in your favor.